Heart Rate Training: The Science of Zones and the Karvonen Formula
How heart rate reflects exercise intensity, where the Karvonen formula and “220 minus age” came from, what research says about training mostly easy, and how to find your own zones.
9 min read · Published September 18, 2026
At a glance
- Your heart rate rises in step with how hard you’re working, which makes it a free, real-time measure of exercise intensity.
- The Karvonen method, from a 1957 Finnish study, sets training zones from your heart rate reserve — the gap between your resting and maximum heart rate — so the zones fit your fitness, not just your age.
- The famous “220 minus age” formula was never derived from careful research. Better formulas exist, but any age-based estimate can be off by 10 beats per minute or more.
- Elite endurance athletes do most of their training at low intensity plus a smaller amount of hard work, and controlled trials suggest this pattern works well for improving fitness.
Ask two people to run at the same speed and one may be chatting comfortably while the other is gasping for air. Speed tells you how fast you’re moving. It doesn’t tell you how hard your body is working. Heart rate does. It responds to hills, heat, fatigue, and fitness, which is why coaches, cardiologists, and fitness watches all use it to gauge exercise intensity. Here’s the science behind heart rate training, where the formulas came from, and how to use your own numbers well.
Why your heart rate reflects effort
When you exercise, your muscles need more oxygen. Your heart delivers it in two ways: by pumping more blood with each beat and by beating more often. Over most of the range from rest to all-out effort, heart rate climbs steadily as the oxygen demand of the work goes up. That makes it a practical stand-in for something much harder to measure outside a lab: how much oxygen your body is using.
The link is especially tight when heart rate is measured relative to your personal range. In a 1997 study, 63 adults did progressively harder cycling tests while researchers tracked both heart rate and oxygen use. The percentage of heart rate reserve — how far a person had moved from their resting heart rate toward their maximum — matched the percentage of their oxygen-uptake reserve almost exactly[1]. In plain terms, 60% of your heart rate reserve means you’re working at about 60% of your aerobic capacity above rest. That’s the idea at the heart of the Karvonen method.
A brief history: from a Finnish treadmill study to your wrist
In 1957 the Finnish physiologist Martti Karvonen and his colleagues published a small study of male medical students who trained by running on a treadmill[2]. They wanted to know how hard training had to be to make the heart fitter. The answer they reported was that training produced clear gains only when heart rate reached at least about 60% of the way from resting to maximum heart rate. To express that threshold, they used the gap between the two — what we now call heart rate reserve. The study was tiny by modern standards, but the method it introduced became the basis for exercise guidelines for decades[3].
Karvonen went on to become one of Finland’s leading heart researchers. He brought the unusually high rate of heart disease among Finnish men to the attention of the American physiologist Ancel Keys, which led to Finland’s inclusion in the landmark Seven Countries Study of diet, lifestyle, and heart disease. In 1972 his advice helped create the North Karelia Project, a community program that went on to cut cholesterol, blood pressure, smoking, and heart deaths across Finland[3]. Keys is also the scientist behind the wartime starvation study described in our article on weight loss and metabolism, and the two men were co-authors on the 1972 paper that gave the body mass index its name — a story told in our article on measuring body fat.
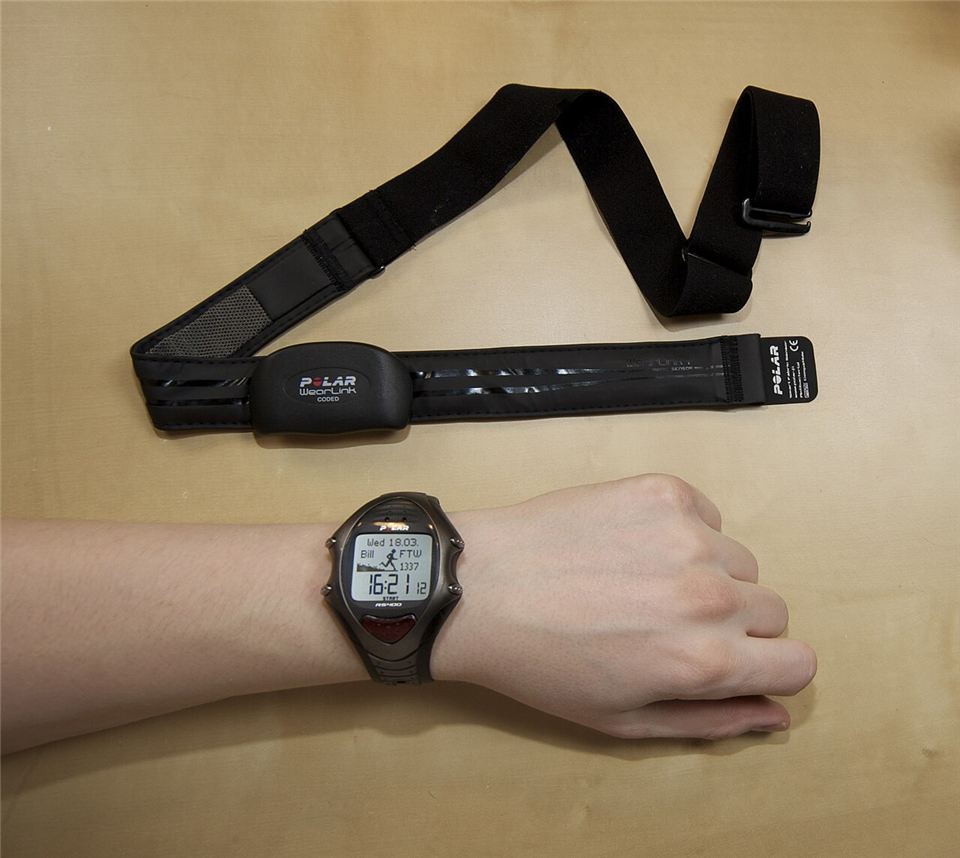
For most of the 20th century, measuring heart rate during exercise meant a lab, electrodes, and an electrocardiogram. Wireless chest-strap monitors, and later optical sensors built into watches, moved heart rate tracking out of the lab and onto everyday runs and rides. Today millions of people see their heart rate zones on their wrist.
The strange story of “220 minus age”
Every zone system needs a maximum heart rate, and the most famous shortcut is 220 minus your age. It usually traces back to a 1971 review on physical activity and heart disease by Samuel Fox, John Naughton, and William Haskell[4]. When exercise scientists Robert Robergs and Roberto Landwehr later went looking for the research behind it, they found that the line had been drawn through data from roughly ten earlier studies, without a formal statistical analysis. They also found that the error in estimating any one person’s maximum heart rate from age is large[5].
Better data came later. In 2001, Hirofumi Tanaka and colleagues pooled results from 351 studies covering 18,712 people and then tested their equation in a lab study of 514 healthy adults. They found that 208 − 0.7 × age fit much better, and that the old formula underestimates maximum heart rate in older adults[6]. Their equation worked equally well for men and women and for active and inactive people.
Even the best formula is only an average, though. A Norwegian study that measured maximum heart rate directly in 3,320 healthy adults found that age alone left a typical error of about 11 beats per minute[7]. Two 40-year-olds could easily have true maximums 20 beats apart. That’s the main reason to treat any age-based number as a starting point, and to use a measured maximum if you have one.
How the Karvonen formula works
The Karvonen method places each training intensity inside your personal heart rate range instead of scaling your maximum heart rate:
Target heart rate = resting heart rate + (maximum − resting) × intensity
Take a 40-year-old with a resting heart rate of 60. Tanaka’s formula estimates a maximum of 208 − 28 = 180, so the heart rate reserve is 120 beats. At 70% intensity, the target is 60 + 0.7 × 120 = 144 beats per minute. The simpler “70% of maximum” method would give only 126. Because the Karvonen method starts from your resting heart rate, it adjusts as you get fitter: resting heart rate usually falls with endurance training, and your zones shift with it.
The American College of Sports Medicine uses the same approach in its exercise guidelines, describing roughly 40–59% of heart rate reserve as moderate intensity and 60–89% as vigorous. It recommends that most adults get at least 150 minutes of moderate or 75 minutes of vigorous cardio each week[8].
What the zones mean
Most watches and training plans divide the range into five zones. The names and boundaries vary between brands, but the logic is similar:
- Zone 1 (about 50–60%) — very light: warm-ups, cool-downs, and recovery.
- Zone 2 (60–70%) — light: an easy, conversational effort you can keep up for a long time.
- Zone 3 (70–80%) — moderate: steady and comfortably hard.
- Zone 4 (80–90%) — hard: near the point where lactate starts building up quickly, sustainable for tens of minutes.
- Zone 5 (90–100%) — maximal: short intervals of a few minutes at most.
Scientists often use a simpler three-zone model built around two physiological turning points, called the first and second ventilatory or lactate thresholds. Below the first, breathing is easy and lactate stays low. Above the second, fatigue builds quickly[9]. The five-zone system is a finer-grained version of the same idea.
Should you train mostly easy?
One of the most influential findings in endurance research is how little of their training top athletes do at medium intensity. When the sports scientist Stephen Seiler tracked every session of a group of nationally competitive junior cross-country skiers for 32 days, about 75% of their endurance sessions were below the first threshold. About 15–20% were well above the second, and surprisingly little time was spent in between[9]. Similar patterns have been reported across other endurance sports. This approach is known as polarized training, or informally as the “80/20” rule.
Controlled trials support it, at least in trained athletes. In a nine-week study, 48 well-trained runners, cyclists, triathletes, and skiers were randomly assigned to one of four programs, with training intensity controlled by heart rate. The polarized group improved peak oxygen uptake by 11.7% and time to exhaustion by 17.4%, the biggest gains of the four. Groups that trained mostly at threshold or simply added more volume saw little further improvement[10].
Keep the context in mind. These studies involved fit athletes, and the samples were small. For beginners, almost any regular aerobic exercise improves fitness. Still, the lesson carries over well: make easy days truly easy so you have the energy to make hard days hard. Heart rate is a simple way to keep yourself honest on the easy days, when it’s tempting to drift into a medium effort every time.
Why your heart rate doesn’t always match your effort
Heart rate is useful, but it isn’t a perfect speedometer. During long sessions, it tends to creep upward even when your pace stays the same, a pattern called cardiovascular drift. After about 10–20 minutes of exercise, the amount of blood the heart pumps with each beat gradually falls, and heart rate rises[11]. Heat and dehydration make this drift worse. So an hour into a hot run, your heart rate may say “zone 3” while your pace is still easy.
Heart rate also lags behind sudden changes. During a short sprint, it may not catch up until the interval is almost over, which is why many coaches use pace or power for short, hard efforts and save heart rate for steady ones. Caffeine, poor sleep, illness, stress, altitude, and medications such as beta blockers can all shift your numbers too. If your heart rate is unusually high at an easy pace, it’s often a sign to take it easy that day.
Resting heart rate: a number worth knowing
Your resting heart rate isn’t only an input to the Karvonen formula. It’s also a health marker. A 2016 meta-analysis of 46 studies covering about 1.2 million people found that each 10-beat increase in resting heart rate was associated with a 9% higher risk of death from any cause over the follow-up periods[12]. That’s an association, not proof that a lower number protects you, but it’s one reason a slowly falling resting heart rate is a welcome sign of improving fitness. How you breathe affects your heart rate from beat to beat, too — see our article on slow breathing for how that works.
How training by heart rate can benefit you
- Easy days stay easy. A heart rate ceiling stops you from turning every session into a medium-hard grind, which helps recovery and makes hard sessions more productive.
- Effort that adapts to conditions. On hills, in heat, or on a tired day, heart rate reflects what your body is actually doing, even when your pace doesn’t.
- A clear sign of progress. Covering the same route at the same pace with a lower heart rate is one of the most satisfying signs that your aerobic fitness is improving.
- A sensible guardrail. For people returning to exercise, a heart rate range gives a concrete way to build up gradually instead of guessing.
Getting accurate zones
Start with a good resting heart rate: count your pulse for a full minute right after waking, before getting out of bed, and average several mornings. A fitness watch’s overnight resting value works well too. For your maximum, a measured value beats any formula. Some people record the highest heart rate they see at the end of an all-out race or hill repeats. If you haven’t exercised hard in a while, have a heart condition, or take medication that affects heart rate, check with a doctor before any maximal effort.
Then put the numbers into the Heart Rate Zone Calculator, which uses the Karvonen formula and lets you enter a measured maximum or estimate one from your age. Recheck your resting heart rate every few months as your fitness changes. To turn your zones into race plans, see our article on pacing strategy, and for the strength side of fitness, read about progressive overload.
Try it yourself
Put the science into practice with this free tool — no sign-up, right in your browser.
References
- Swain, D. P., & Leutholtz, B. C. (1997). Heart rate reserve is equivalent to %VO2 reserve, not to %VO2max. Medicine & Science in Sports & Exercise, 29(3), 410–414. doi:10.1097/00005768-199703000-00018
- Karvonen, M. J., Kentala, E., & Mustala, O. (1957). The effects of training on heart rate: A longitudinal study. Annales Medicinae Experimentalis et Biologiae Fenniae, 35(3), 307–315. Link
- Ignaszewski, M., Lau, B., Wong, S., & Isserow, S. (2017). The science of exercise prescription: Martti Karvonen and his contributions. BC Medical Journal, 59(1), 38–41. Link
- Fox, S. M., Naughton, J. P., & Haskell, W. L. (1971). Physical activity and the prevention of coronary heart disease. Annals of Clinical Research, 3(6), 404–432. Link
- Robergs, R. A., & Landwehr, R. (2002). The surprising history of the “HRmax=220-age” equation. Journal of Exercise Physiology Online, 5(2), 1–10. Link
- Tanaka, H., Monahan, K. D., & Seals, D. R. (2001). Age-predicted maximal heart rate revisited. Journal of the American College of Cardiology, 37(1), 153–156. doi:10.1016/S0735-1097(00)01054-8
- Nes, B. M., Janszky, I., Wisløff, U., Støylen, A., & Karlsen, T. (2013). Age-predicted maximal heart rate in healthy subjects: The HUNT Fitness Study. Scandinavian Journal of Medicine & Science in Sports, 23(6), 697–704. doi:10.1111/j.1600-0838.2012.01445.x
- Garber, C. E., Blissmer, B., Deschenes, M. R., Franklin, B. A., Lamonte, M. J., Lee, I.-M., Nieman, D. C., & Swain, D. P. (2011). Quantity and quality of exercise for developing and maintaining cardiorespiratory, musculoskeletal, and neuromotor fitness in apparently healthy adults: Guidance for prescribing exercise. Medicine & Science in Sports & Exercise, 43(7), 1334–1359. doi:10.1249/MSS.0b013e318213fefb
- Seiler, K. S., & Kjerland, G. Ø. (2006). Quantifying training intensity distribution in elite endurance athletes: Is there evidence for an “optimal” distribution? Scandinavian Journal of Medicine & Science in Sports, 16(1), 49–56. doi:10.1111/j.1600-0838.2004.00418.x
- Stöggl, T., & Sperlich, B. (2014). Polarized training has greater impact on key endurance variables than threshold, high intensity, or high volume training. Frontiers in Physiology, 5, 33. doi:10.3389/fphys.2014.00033
- Coyle, E. F., & González-Alonso, J. (2001). Cardiovascular drift during prolonged exercise: New perspectives. Exercise and Sport Sciences Reviews, 29(2), 88–92. doi:10.1097/00003677-200104000-00009
- Zhang, D., Shen, X., & Qi, X. (2016). Resting heart rate and all-cause and cardiovascular mortality in the general population: A meta-analysis. Canadian Medical Association Journal, 188(3), E53–E63. doi:10.1503/cmaj.150535
This article is for general education and isn’t medical advice. The exercises and calculators on this site are general wellness tools, not diagnostic tests or treatments — see the Disclaimer for details. Spotted an error or a newer study we should know about? Let us know.
More articles
- Training · 7 min readPacing Strategy: The Science of Running Your Best Race
- Training · 7 min readProgressive Overload: The Science of Getting Stronger
- Reflexes · 7 min readThe Science of Reaction Time: Why Milliseconds Matter
- Eye training · 6 min readSmooth Pursuit: How Your Eyes Follow a Moving Target
- Eye training · 7 min readPeripheral Vision and Visual Attention: Seeing More Than You Look At
- Focus · 7 min readThe Schulte Table: The Science of Visual Search and Focus
- Memory · 6 min readWorking Memory: How Much Can Your Mind Hold at Once?
- Math · 6 min readMental Math: What Happens in Your Brain When You Calculate
- Breathing · 7 min readBox Breathing and 4-7-8 Breathing: The Science of Slow Breathing
- Nutrition · 7 min readProtein, Carbs, and Fat: The Science of Macronutrients
- Body composition · 7 min readMeasuring Body Fat: What the Tape, the Scale, and the Scanner Tell You
- Nutrition · 7 min readWhy Weight Loss Slows Down: The 3,500-Calorie Rule and Your Metabolism